What to consider when choosing between index-weighting approaches
The choice between different index-weighting approaches can have an important portfolio impact in terms of sector and factor exposures.

The choice between different index-weighting approaches can have an important portfolio impact in terms of sector and factor exposures.
"Equal-weighting changes the risks – it doesn’t remove them."
David Hsu
Head of Index Equity and ETF Product Specialism, Vanguard Europe

When it comes to investing in the equity market via an index fund or ETF, an important consideration is the index weighting methodology. Two common approaches are market-capitalisation weighting and equal weighting. The market-cap-weighted approach provides “passive” exposure to the targeted market by weighting all of its assets in accordance with their capitalisation – hence, it resembles the market itself. It has been around for many years and is the better established of the two.
The equal-weighted approach, on the other hand, holds the same securities but weights them equally. Relative to the market, it is more of an active strategy as it contains relative risk – most obviously because it underweights large-cap stocks and overweights small-cap stocks. This approach tends to see periodic increases in popularity—for example, when investors are concerned that a subset of the market, such as an industry—may take up too much of the total.
While there are benefits to either approach, investors should ensure they understand what each means in terms of costs, risks and ultimately the investment exposure. Here, we explain the basic mechanics of each approach and why we believe that a market-cap-weighted index could be the better option for many investors seeking broad equity exposure, looking at US equities in particular.
A market-cap-weighted index assigns weights to constituent securities based on their (free-float) market capitalisation1. This means that more highly capitalised (or larger-cap) companies have a greater influence on index performance. The S&P 500 Index and the Russell 3000 are well-known examples of market-cap-weighted indices.
The advantages of such an approach include:
The potential drawbacks to keep in mind include:
An equal-weighted index, meanwhile, assigns the same weight to each constituent security, regardless of its market capitalisation. A common example of an index that uses this methodology is the S&P 500 Equal Weight Index.
Advantages of an equal-weighted approach typically include:
The most important downsides to the approach are:
Even though it is not an outright downside, but rather a practical necessity, it is important to point out that the weights of companies included in an equal-weighted index are equal only at each rebalance. For example, an index with a quarterly rebalance is equally weighted only four times per year; depending on the stock price movements of its constituents, weights can increase or decrease over the course of the subsequent quarter. And keep in mind, rebalancing more frequently would translate into higher costs for the investor.
Some investors might consider the equal-weighted approach as a way to mitigate against concentration risk. For these investors, it is important to understand that switching from a cap-weighted index to an equal-weight index does not eliminate risk, it just shifts the sources of risk an investor faces.
For illustrative purposes, we compare the S&P 500 and the Russell 3000 indices (market-cap-weighted) with their equal-weighted counterparts. It should be noted that all of these indices do provide broad exposure to the US equity universe. Digging beneath the surface, however, we find a range of important differences.
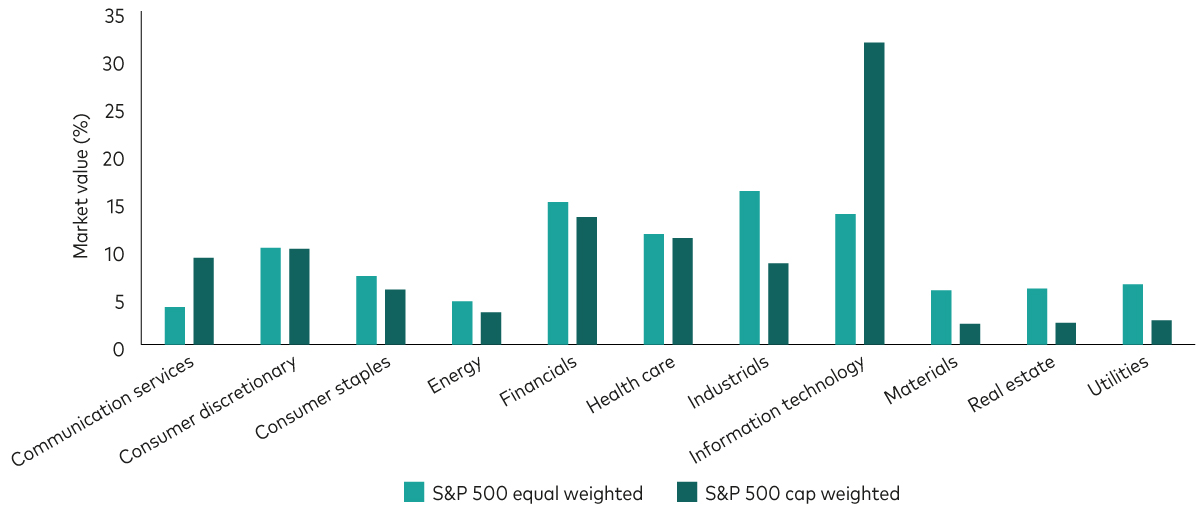
If the aim of equal weighting were to, say, reduce exposure to the information technology sector, we find that the approach achieved its objective (as the chart below for the S&P 500 illustrates). However, the price of achieving this objective is active risk relative to the market. While IT is underweight, other sectors—such as industrials, materials, real estate and utilities—are almost double their weight in the market. Whenever an overweighted sector under- or outperforms in relative terms, the equal-weighted index under- or outperforms the market (i.e., its cap-weighted equivalent).
Sector breakdown: There are important differences between index-weighting approaches

Source: Bloomberg, as of 11 December 2024. Chart shows sector compositions of S&P 500 Equal Weight Index and the S&P 500 Index (weighted by market cap).
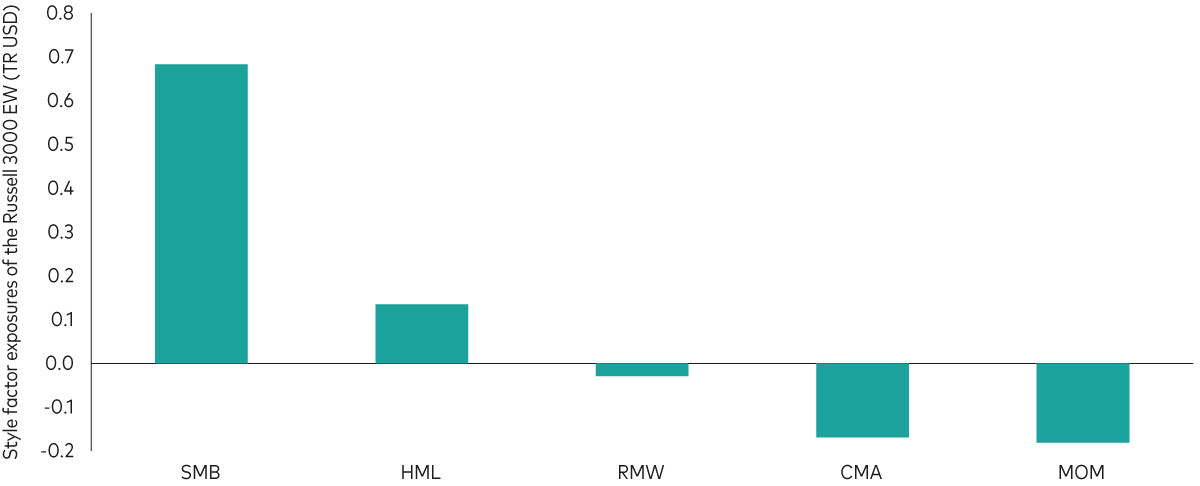
As well as exposing investors to active risk as a result of deviations in sector weights, equal weighting also leads to active factor risk. To demonstrate this, we have analysed the Russell 3000 Equal Weighted TR USD, an index that contains the majority of US companies3. The figure below shows the exposures of the Russell 3000 equal-weighted index relative to the cap-weighted US equity market itself (represented by the Russell 3000 index, market-cap weighted).
As mentioned above, equal weighting leads to a significant tilt towards small-cap companies. But our analysis also reveals significant tilts towards other factors, such as a positive exposure to value and a negative exposure to momentum. Therefore, if value stocks under- or outperform relative to growth stocks, the equal-weighted index under- or outperforms. Similarly, if momentum performs well/poorly, the equal weighting under- or outperforms cap weighting (all else being equal).
Style factor exposures of the Russell 3000 Equal Weighted TR USD index

Notes: Regressions are run based on monthly total returns in USD observed over the course of January 2000 to June 2024, using data provided by Morningstar. Style factor returns are taken from Kenneth French’s website. The market factor is represented by the returns of the Russell 3000 Index (market-cap weighted). Definitions: SMB (small minus big) is the average return on the three small portfolios minus the average return on the three big portfolios; HML (high minus low) is the average return on the two value portfolios minus the average return on the two growth portfolios; RMW (robust minus weak) is the average return on the two robust operating profitability portfolios minus the average return on the two weak operating profitability portfolios; CMA (conservative minus aggressive) is the average return on the two conservative investment portfolios minus the average return on the two aggressive investment portfolios; MOM (momentum) is the average return on the two high prior return portfolios minus the average return on the two low prior return portfolios.
Source: Morningstar, Vanguard.
If investors chose an equal-weighted (rather than a cap-weighted) index with the objective to outperform the cap-weighted counterpart, the choice makes sense only if the factors to which the equal-weighted index is exposed perform in the right direction. In the short run, this may be overweighted sectors that perform well or underweighted sectors that perform poorly. In the long run, that may be small-cap stocks that outperform large-cap stocks or value stocks that outperform growth.
It may well be that these active views at times pay off. However, investors need to be aware that such active “bets” may not pay off as these factors could perform in a different direction than anticipated – in which case, equal weighting may underperform market-cap weighting.
For investors who are considering investing in an equal-weighted fund with the objective to add a specific style exposure to their portfolio, they may be better off investing directly in a fund that explicitly targets the style, such as a small-cap index fund.
Furthermore, for investors seeking equity exposure that reflects a targeted market in a passive (that is, active risk-neutral) way, a cap-weighted index is the appropriate approach. As mentioned above, the inherent cost advantage afforded by the cap-weighted approach means it is better suited for long-term investors, given the negative impact that higher costs can have when compounded over time.
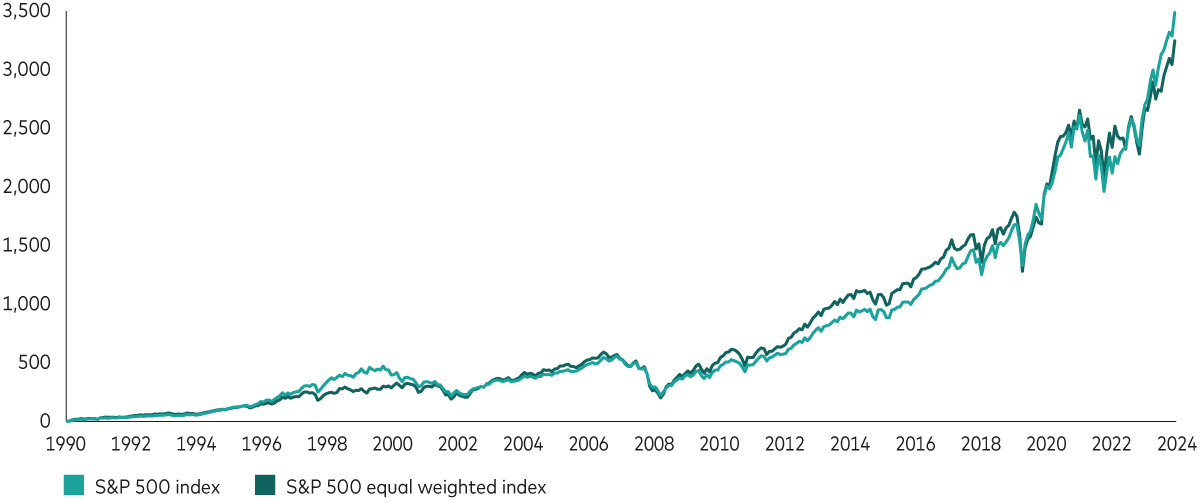
Performance comparison: S&P 500 Index (cap-weighted, SPX) vs. S&P 500 Equal Weight Index (SPW)

Past performance is not a reliable indicator of future results. The performance of an index is not an exact representation of any particular investment, as you cannot invest directly in an index.
Source: Bloomberg, with data showing the period 31 January 2003 (the inception date of the equal-weighted index) to 31 October 2024.
1 Market capitalisation is calculated as the share price of a company multiplied by the number of shares outstanding. To increase the tradability of the index, only the portion of shares that are considered by the index provider to be available for purchase and not be held for the very long term (the so called free-float) is taken into account in most cases.
2 Source: S&P Dow Jones Indices, as of 29 November 2024.
3 We use the Russell 3000 rather than the S&P 500 index for the factor analysis as the S&P 500 index would display a tilt towards large cap not because of market-cap weighting but because of the fact that it only contains the largest 500 stocks of the US equity market.
| Ticker | Name | OCF / TER |
|---|---|---|
| VOO | Vanguard S&P 500 ETF |
0.03% |
| VUAA | 0.07% | |
| VUSD | 0.07% |
As at 21 Jan 2025
Notes:
Data provided by Morningstar is property of Morningstar and Morningstar’s data providers and it should therefore not be copied or distributed. Morningstar and its data providers are not responsible for any certification or representation with respect to data validity, certainty, or accuracy and are therefore not responsible for any losses derived from the use of such information.
Bloomberg® and Bloomberg Indexes mentioned herein are service marks of Bloomberg Finance LP and its affiliates, including Bloomberg Index Services Limited (“BISL”), the administrator of the index (collectively, “Bloomberg”) and have been licensed for use for certain purposes by Vanguard. Bloomberg is not affiliated with Vanguard and Bloomberg does not approve, endorse, review, or recommend the Financial Products included in this document. Bloomberg does not guarantee the timeliness, accurateness or completeness of any data or information related to the Financial Products included in this document.
Vanguard Mexico is not responsible for and does not prepare, edit, or endorse the content, advertising, products, or other materials on or available from any website owned or operated by a third party that may be linked to this email/document via hyperlink. The fact that Vanguard Mexico has provided a link to a third party's website does not constitute an implicit or explicit endorsement, authorization, sponsorship, or affiliation by Vanguard with respect to such website, its content, its owners, providers, or services. You shall use any such third-party content at your own risk and Vanguard Mexico is not liable for any loss or damage that you may suffer by using third party websites or any content, advertising, products, or other materials in connection therewith.
The sale of the VOO, VUAA y VUSD qualifies as a private placement pursuant to section 2 of Uruguayan law 18.627. Vanguard represents and agrees that it has not offered or sold, and will not offer or sell, any VOO, VUAA y VUSD to the public in Uruguay, except in circumstances which do not constitute a public offering or distribution under Uruguayan laws and regulations. Neither the VOO, VUAA y VUSD nor issuer are or will be registered with the Superintendency of Financial Services of the Central Bank of Uruguay to be publicly offered in Uruguay.
The VOO, VUAA y VUSD correspond to investment funds that are not investment funds regulated by Uruguayan law 16,774 dated 27 September 1996, as amended.
Please confirm the following
This website is intended for investors located outside of Mexico. This website is intended only for institutional and sophisticated investors or their equivalent in your jurisdiction, if you are not an institutional or sophisticated investor or the equivalent in your jurisdiction or if you are located in Mexico you should refrain from using this site.
This website or the information contained or incorporated by reference in this website has not been, and will not be submitted to become approved/verified by, or registered with, any relevant government authorities under the local laws. This website is not intended for and should not be accessed by persons located or resident in any jurisdiction where the publication or availability of this website is prohibited or contrary to local law or regulation or would subject any Vanguard entity to any registration or licensing requirements in such jurisdiction. It is your responsibility to be aware of, to obtain all relevant regulatory approvals, licenses, verifications and/or registrations under, and to observe all applicable laws and regulations of any relevant jurisdiction in connection with your access to this website
This site uses cookies for different purposes, if you want to know more, please visit our cookie policy in the following link: https://www.vanguardsouthamerica.com/en/home/cookie-policy