Este artículo está disponible sólo en inglés.
“We now believe the outperformance of emerging market corporates over sovereign credit has run its course.”
portfolio manager, fixed income

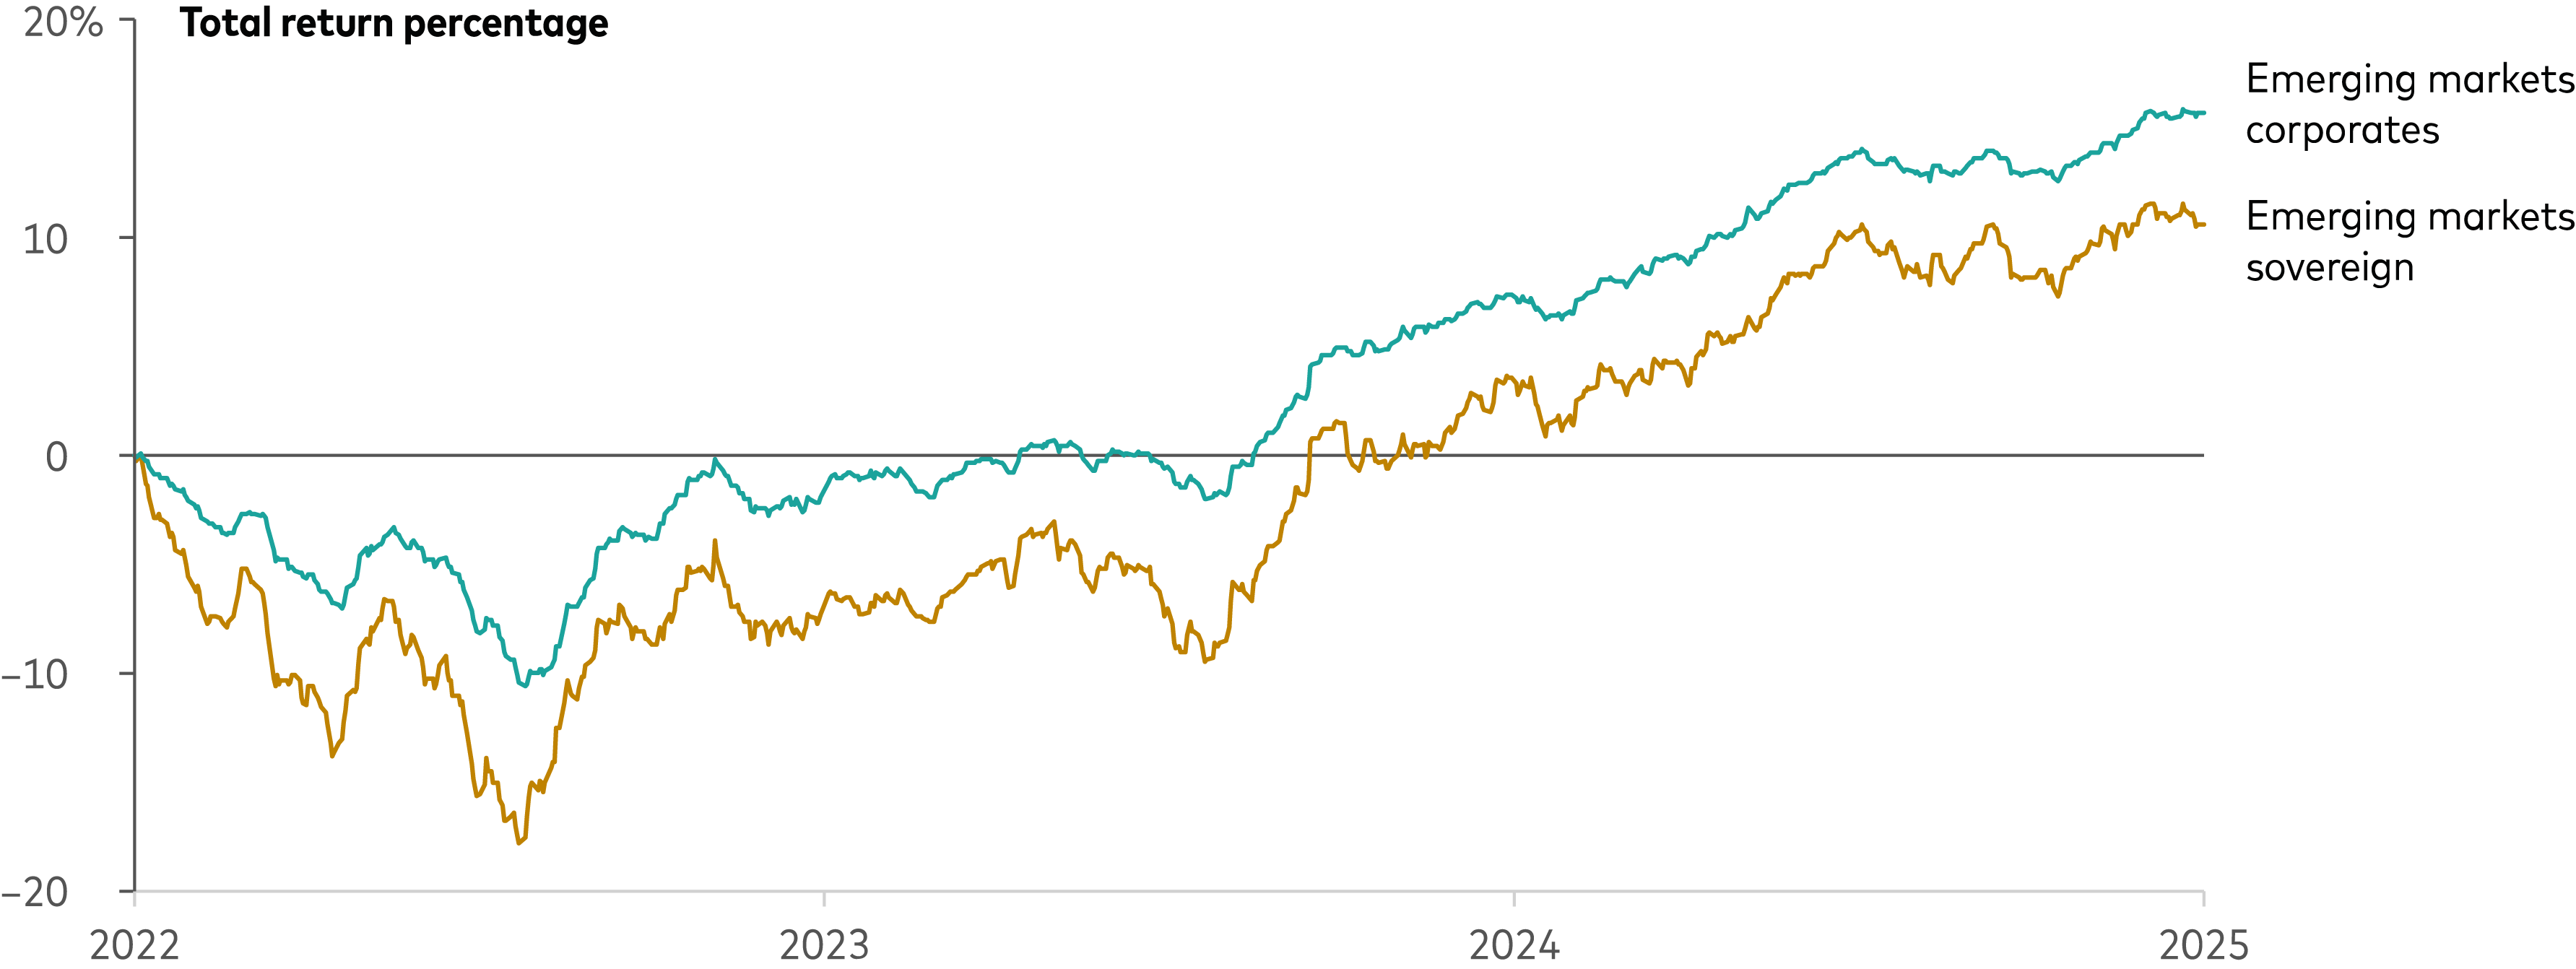
EM corporates have outperformed their sovereign counterparts since 2022, supported by a combination of larger spread compression and a shorter duration profile.
Total return for EM corporate bonds compared with sovereign debt

Source: Bloomberg, as of March 31, 2025. Indexes used are: EM sovereign—J.P. Morgan EMBI Global Diversified Index; EM corporates—J.P. Morgan CEMBI Global Diversified Index.
But we believe we are entering a new macroeconomic regime characterized by slower growth due to tariffs and uncertainty, while EM corporates’ valuations have reached very tight levels. Let’s explore the potential benefits of owning EM sovereign debt over EM corporates.
EM sovereign offers higher spreads and more duration than corporates
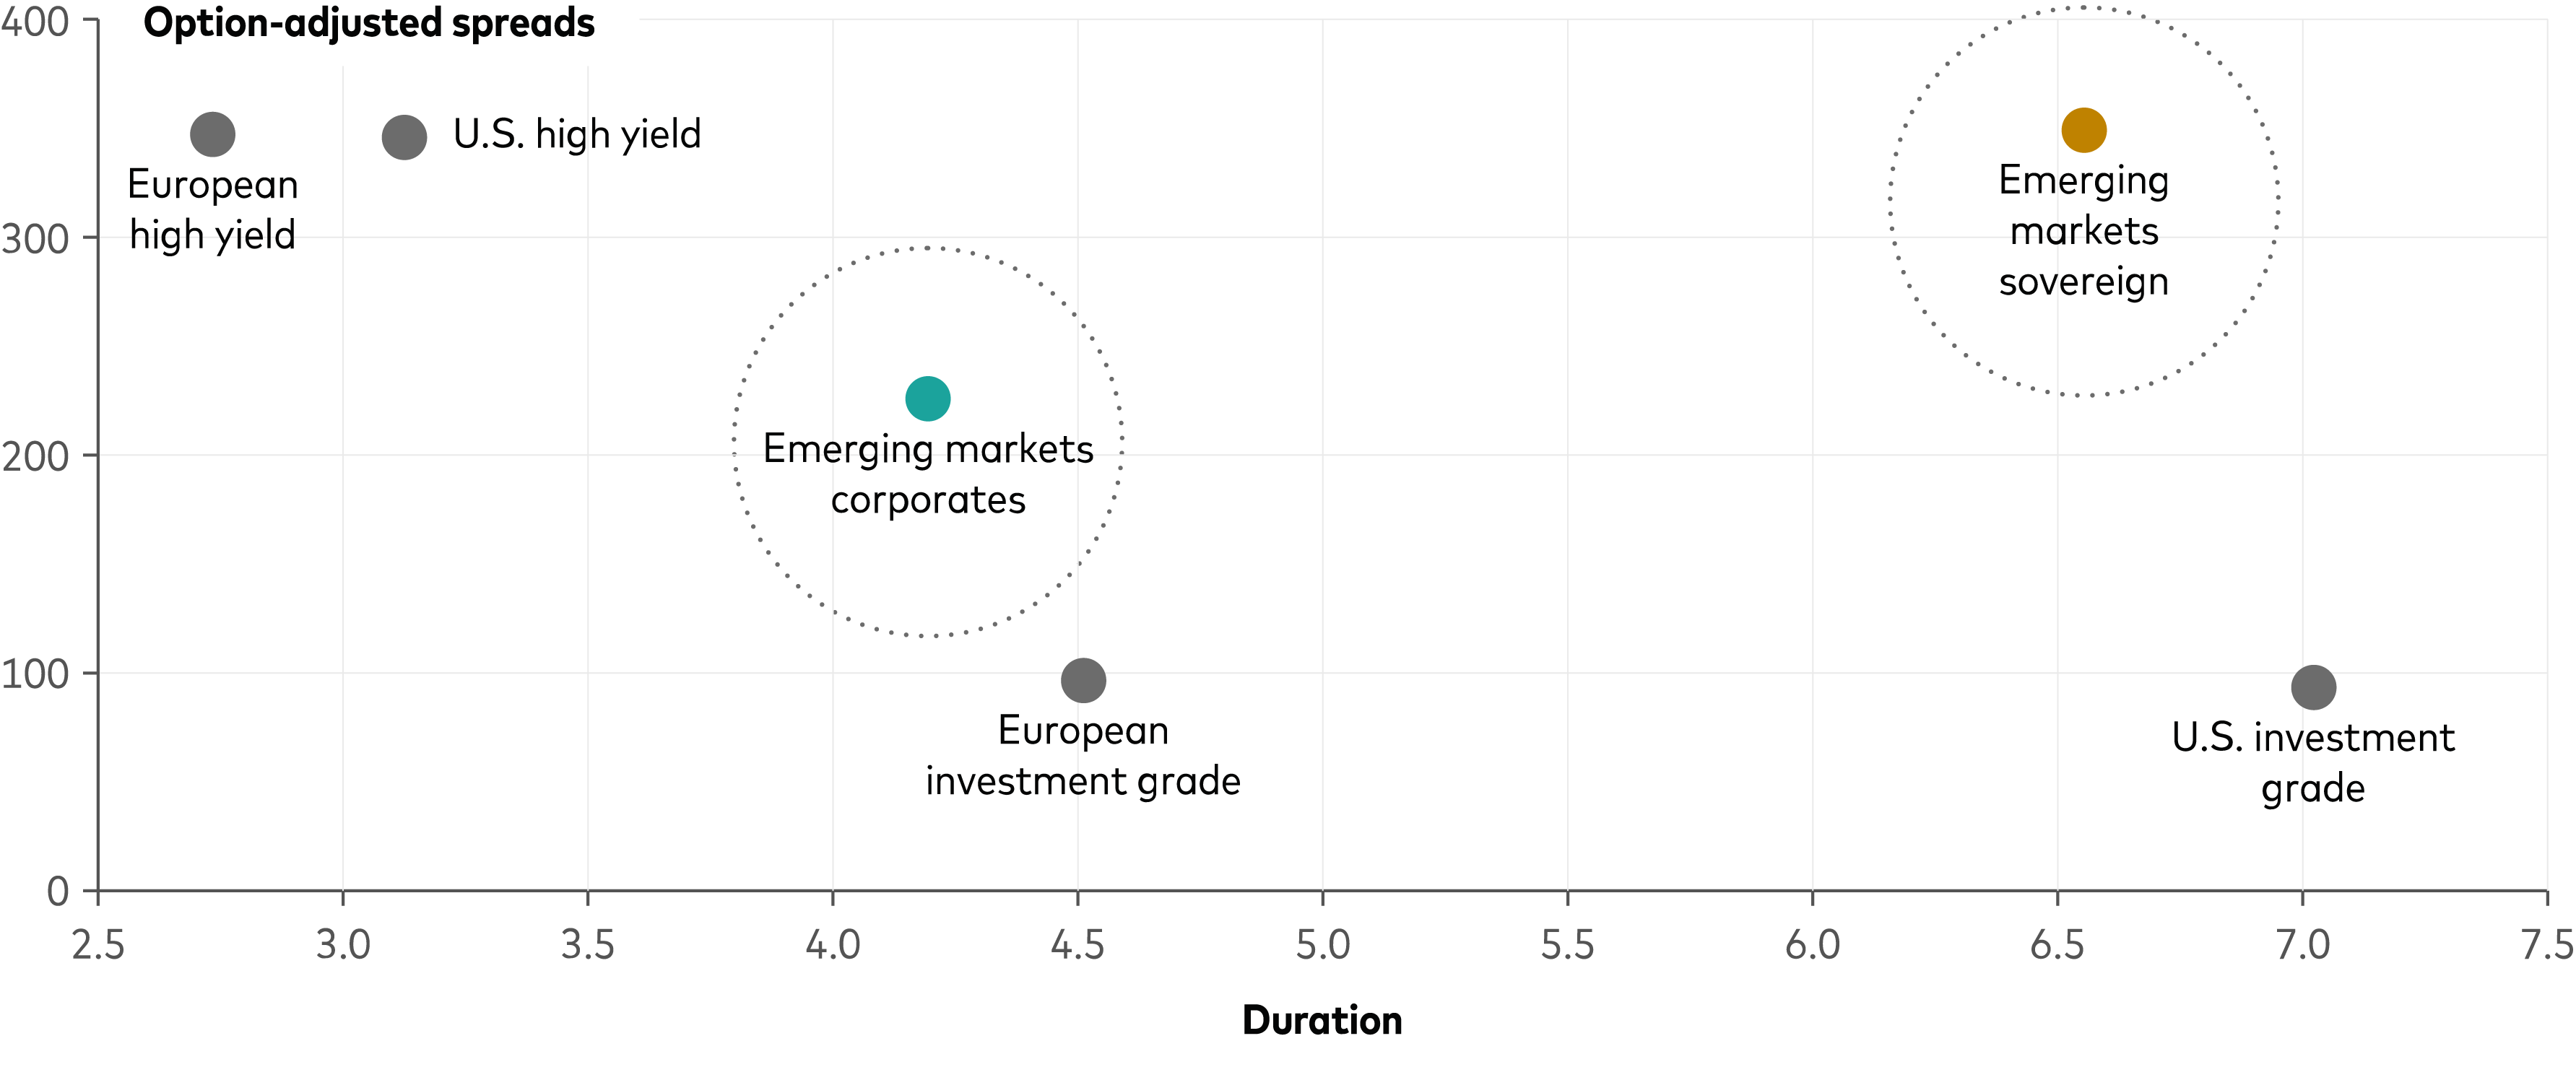
EM sovereign debt offers a unique combination of spreads and duration, with an attractive all-in yield as of March 31, 2025, of 7.78% and longer duration of 6.6 years, which is preferred during periods of market stress or risk-off sentiment.
In contrast, EM corporates offer less spread compression potential, lower yields (6.77%), and less duration (4.2 years) as of March 31, 2025
Option-adjusted spreads and durations for various types of debt

Source: Bloomberg, as of March 19, 2025. Indexes used are: U.S. high yield—ICE BAML US High Yield Index; European high yield—ICE BAML European High Yield Index; European investment grade—Bloomberg Euro Aggregate Corporates Index in EUR; U.S. investment grade—Bloomberg Global Aggregate Corporates US Dollar Index; EM hard currency sovereign—J.P. Morgan EMBI Global Diversified Index; EM corporates—JPM CEMBI Global Diversified Index.
The shorter duration aspect has benefited corporates in the rising rate environment of the past three years. However, we believe that structural tailwind is behind us, and we prefer having exposure to longer-duration assets such as EM sovereigns.
Fundamentals shift?
Before the global financial crisis, the private sector was highly leveraged, leading to significant vulnerabilities within financial markets. In response to the ensuing economic turmoil, the public sector—through sovereign balance sheets—intervened to stabilize the economy via quantitative easing and extensive bailouts. This period saw a revival of financial repression, as governments worldwide implemented strategies to stimulate the private sector. Over the years since 2008, we have witnessed a range of measures designed to foster corporate investment and economic recovery:
- Quantitative easing
- Ultra-low interest rates
- Fiscal stimulus
- Credit facilities
This resulted in a significant improvement in the overall quality of corporate balance sheets over the past decade. However, we believe there is a potential for structural change as the pendulum swings from strong corporate balance sheets to stronger sovereign balance sheets.
In emerging markets, sovereign fundamentals are improving post-COVID, with 2024 upgrades outpacing downgrades 2:1, the highest ratio in 10 years. No defaults are expected in 2025.
On the corporate side, while balance sheets are healthy, optimism has peaked. Sectors such as energy, industrials, autos, and chemicals are deteriorating due to Europe's slowdown and China's overcapacity, causing price pressure and added leverage.
Tariffs add to these challenges and raise a critical question: Will companies’ balance sheets need to absorb the financial pressure, or can they pass these costs on to consumers?
In the United States, recent data point toward lower consumer confidence. This means there is a risk that corporations won’t be able to raise prices to fully reflect higher costs from tariffs, leading to reduced corporate margins and a deterioration of overall balance sheets.
Valuations: EM corporates are expensive, versus both history and sovereign credit
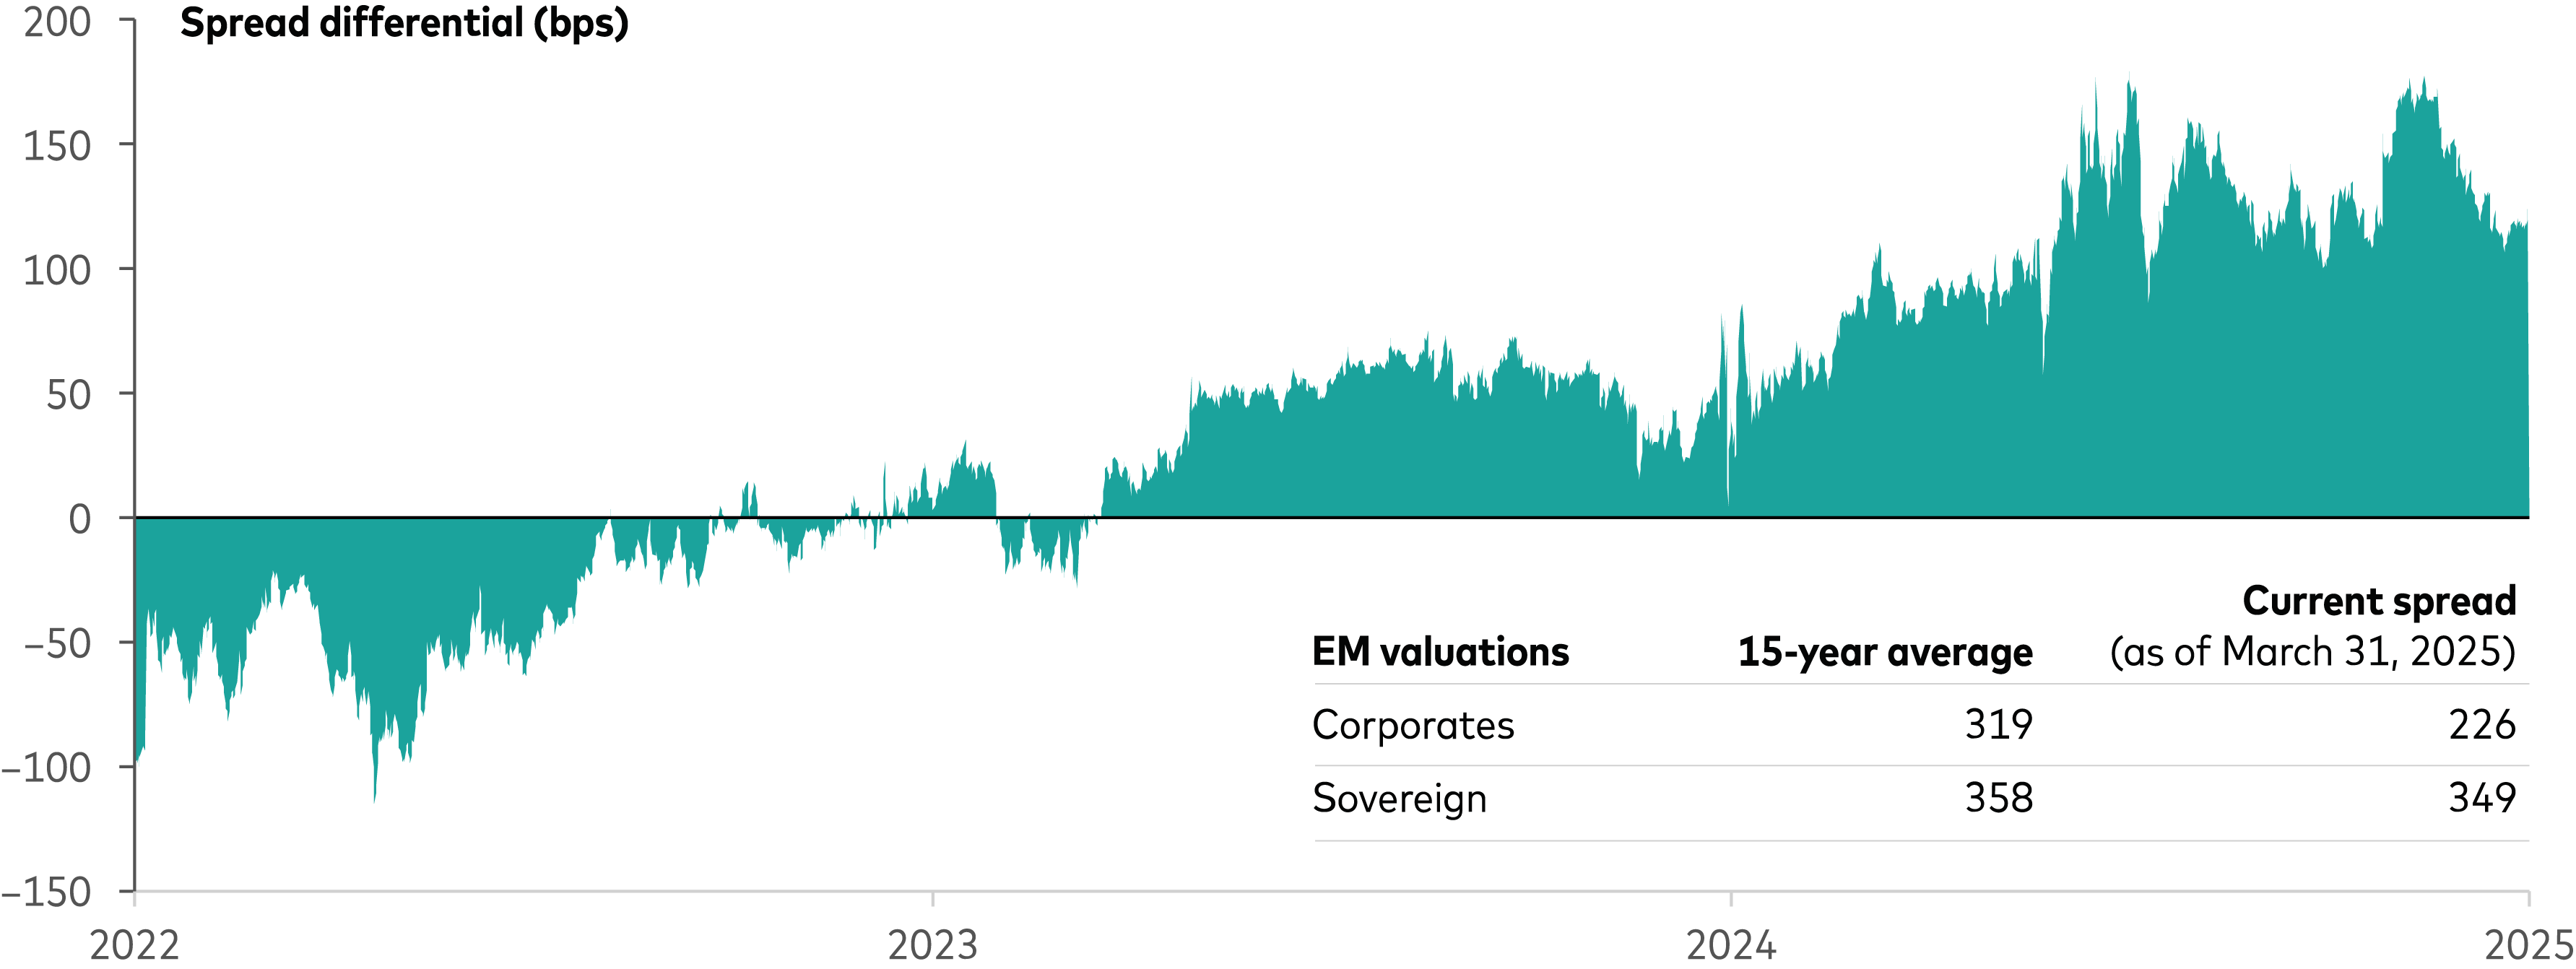
On a historical basis, EM corporates’ valuations (spreads) are tight and through the typical range, while sovereign debt is priced closer to its long-term average.
As EM corporate valuations compressed to a tighter level versus history compared with their sovereign counterparts, we have seen an increasing spread differential between sovereign and corporates over the last 15 years, meaning sovereign debt overall has become more attractively priced on a relative value basis.
Historical spread differential for EM sovereign and EM corporate debt

Source: Bloomberg, as of March 31, 2025. The chart shows the spread-to-worst differential. Indexes used are JPM CEMBI Broad Diversified Index (JCBDAGTW Index) and JPM EMBI Broad Diversified Index (JPBYAGSW Index).
Sovereigns overall offer better liquidity profiles
While the liquidity profile of sovereign debt varies greatly, EM corporates do not generally benefit from the same level of liquidity as EM sovereign credits.
Sovereign issuers typically have well-developed bond yield curves with large issues at varying maturity points. Sovereign issuers, on average, have six bonds outstanding, at an average size of approximately $1.2 billion. This is less typical in the corporate space. The average corporate issuer has two bond issues outstanding, at an average size of approximately $600 million.
In the event of a sell-off (driven by slowing growth, tariff risks, or other factors) EM corporates may face greater liquidity disadvantages than sovereign debt. And at current valuations, we do not believe that investors are being compensated for this liquidity risk.
Different default dynamic
Both EM sovereign and corporate issuers might be subject to periods of distress, leading to drawdowns and, in some case, defaults. Although we do not anticipate an increase in defaults in either space, it is worth highlighting the differences in default dynamics and recovery rates between the two asset classes.
Sovereign defaults are slower and more predictable, often stemming from prolonged economic mismanagement, with access to multilateral aid providing additional time. Corporate defaults can be sudden, triggered by specific risks such as fraud or governance issues.
From 2008 to 2024, sovereign debt typically had higher recovery rates (56%) compared with corporate debt (34%) because of multilateral support and more standardized processes, whereas corporate debt involves more legal complexities.
Comparing default and recovery rates for EM corporate and sovereign debt

Source: JP Morgan. Corporates include 17 years from 2008 to 2024; sovereigns include 16 years from 2008 to 2023.
Conclusion
Given the current macroeconomic environment, characterized by slower growth and tight EM corporate valuations, we believe that exposure to EM sovereigns offers investors a better chance of long-term investment success. Better valuations, higher liquidity, and improving fundamentals support this strategy. While there are still compelling opportunities to identify selective names within EM corporates, this approach emphasizes security selection rather than a broader asset allocation to EM corporates.
Notes:
All investing is subject to risk.
Bloomberg® and Bloomberg Indexes mentioned herein are service marks of Bloomberg Finance LP and its affiliates, including Bloomberg Index Services Limited (“BISL”), the administrator of the index (collectively, “Bloomberg”) and have been licensed for use for certain purposes by Vanguard. Bloomberg is not affiliated with Vanguard and Bloomberg does not approve, endorse, review, or recommend the Financial Products included in this document. Bloomberg does not guarantee the timeliness, accurateness or completeness of any data or information related to the Financial Products included in this document.
Vanguard Mexico is not responsible for and does not prepare, edit, or endorse the content, advertising, products, or other materials on or available from any website owned or operated by a third party that may be linked to this email/document via hyperlink. The fact that Vanguard Mexico has provided a link to a third party's website does not constitute an implicit or explicit endorsement, authorization, sponsorship, or affiliation by Vanguard with respect to such website, its content, its owners, providers, or services. You shall use any such third-party content at your own risk and Vanguard Mexico is not liable for any loss or damage that you may suffer by using third party websites or any content, advertising, products, or other materials in connection therewith.